
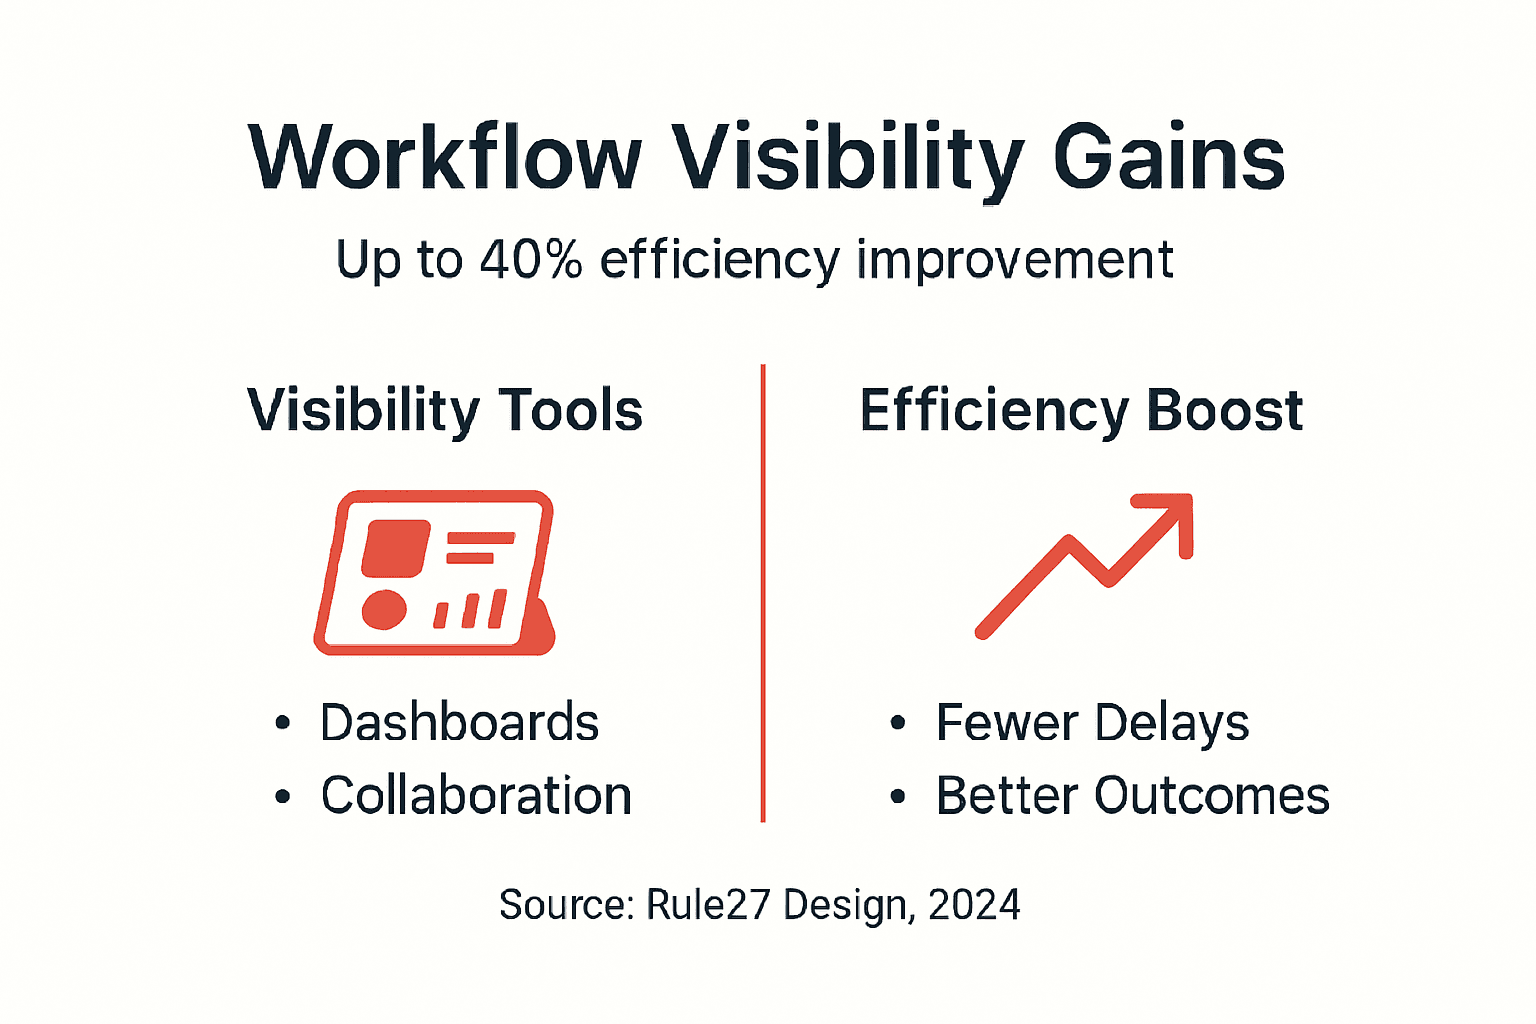
Discover how customized digital solutions deliver 40% efficiency gains through enhanced workflow visibility. Practical guide for SaaS operations managers.
Your operations team is drowning in disconnected tools, missing deadlines, and wondering where projects actually stand. Without clear workflow visibility, even the most talented teams waste hours searching for updates, duplicating effort, and firefighting avoidable problems. This guide shows you how to implement customized digital solutions that deliver measurable efficiency gains, reduce bottlenecks, and give you the operational clarity your growing SaaS company needs to scale effectively.
Key Takeaways
| Point | Details |
|---|---|
| Foundation First | Comprehensive workflow audits and targeted KPIs are essential before implementation. |
| Dashboard Design | Limit metrics to 5 to 7 key indicators to maintain 30% higher user engagement. |
| Collaboration Impact | Real-time collaboration tools reduce task duplication by approximately 25%. |
| AI Enhancement | Predictive analytics identify bottlenecks before they impact delivery timelines. |
| Training Matters | Proper user training increases adoption rates by 45% and ensures long-term success. |
Prerequisites and Preparation
You cannot fix what you cannot see. Before investing in new visibility tools, you need a clear understanding of your current workflows, pain points, and objectives.
Start with a comprehensive workflow audit. Map every process from task assignment through completion, documenting handoffs, approval chains, and common delay points. Research shows that 100% of successful implementations begin with this foundational step. Without it, you risk automating broken processes or building dashboards that track the wrong metrics.
Next, define 4 to 6 KPIs that directly align with your team’s operational goals. Generic metrics like “tasks completed” tell you nothing useful. Instead, focus on indicators that reveal bottlenecks and efficiency patterns: average task completion time, frequency of delayed handoffs, resource utilization rates, and cross-team dependency impacts. These targeted metrics will guide your dashboard design and ensure you measure what actually matters.
Assess your existing tool ecosystem honestly. Most growth-stage SaaS companies have accumulated a patchwork of point solutions that don’t communicate with each other. Identify which tools provide value, which create friction, and where integration opportunities exist. Understanding what is working with enterprise software insights helps you build on strengths rather than starting from scratch.
Secure leadership buy-in and IT support early. Workflow visibility initiatives fail without executive sponsorship and technical resources. Present the business case clearly: reduced delays, improved resource allocation, and measurable efficiency gains. IT teams need to be partners in evaluating technical feasibility, security requirements, and integration complexity.
Essential Preparation Steps:
- Conduct a full workflow audit documenting current processes and pain points
- Define 4 to 6 KPIs aligned with specific operational goals
- Inventory existing tools and identify integration opportunities
- Secure executive sponsorship and allocate technical resources
- Establish baseline metrics for measuring post-implementation improvements
Implementing Custom Dashboard Solutions
Dashboards fail when they try to show everything. The goal is not comprehensive data display but actionable insight.
Limit your dashboard to 5 to 7 key performance indicators. Studies demonstrate that dashboards exceeding seven metrics experience a 30% decrease in user engagement. Users tune out when overwhelmed by information, defeating the purpose of visibility. Choose metrics that directly impact daily decisions and eliminate vanity numbers that look impressive but drive no action.
Prioritize real-time data visualization tailored to SaaS operational workflows. Static reports force teams to work with outdated information. Dynamic dashboards that update continuously enable proactive responses to emerging issues. Design visualizations that make patterns obvious at a glance: color-coded status indicators, trend lines showing performance over time, and alert thresholds that highlight exceptions requiring attention.
Integrate AI-driven analytics to move beyond basic reporting. Custom digital solutions with embedded intelligence can surface insights humans might miss: correlations between team workload and quality metrics, early warning signals for potential delays, or optimization opportunities based on historical patterns. These predictive capabilities transform dashboards from reactive scorecards into proactive management tools.
Invest heavily in interface design. The most powerful dashboard is worthless if your team finds it confusing. Work with designers who understand operational workflows, not just visual aesthetics. Test extensively with actual users and iterate based on feedback. A clean, intuitive interface dramatically improves adoption and ensures the tool becomes part of daily routines rather than another obligation.
Build for evolution. Your workflows will change as your company grows. Design dashboards with customization capabilities so teams can adjust metrics, add new data sources, and modify views without requiring developer intervention. This flexibility, emphasized in custom CRM solutions, ensures your visibility tools scale alongside your operations.
Dashboard Implementation Checklist:
- Restrict metrics to 5 to 7 actionable KPIs maximum
- Enable real-time data updates across all workflow stages
- Embed AI analytics for predictive insights and optimization recommendations
- Design intuitive interfaces tested with actual end users
- Build customization capabilities for future workflow changes
Pro Tip: Start with a single team or department as a pilot. Perfect the dashboard design and data flows in a controlled environment before rolling out company-wide. Early wins build momentum and provide concrete examples that accelerate broader adoption. The lessons learned from business-optimized software implementations consistently show pilot programs reduce risk and improve final outcomes.
Leveraging Collaboration for Workflow Visibility
Dashboards show you the numbers. Collaboration tools show you the work behind them.
Integrate real-time communication platforms directly into your workflow systems. When task discussions happen in separate channels disconnected from project tracking, critical context gets lost. Embedding communication within workflow tools ensures every conversation, decision, and update is captured alongside the work itself. This creates a complete audit trail and eliminates the “what was decided” confusion that wastes hours.
Transparent task assignments reduce duplication by approximately 25%. When everyone sees who owns what, teams stop accidentally working on the same problems or assuming someone else is handling a critical task. Clear ownership also improves accountability. If a task stalls, the bottleneck is immediately visible rather than hidden in someone’s overflowing inbox.
Facilitate continuous feedback loops through integrated commenting and approval workflows. Problems caught early are exponentially easier to fix than issues discovered at project completion. Real-time visibility into work-in-progress lets stakeholders provide input when it matters most. This iterative approach, detailed in our digital workspace guide, prevents costly rework and keeps projects aligned with expectations.

Ensure task visibility extends across team boundaries. Silos destroy efficiency in growing companies. When marketing cannot see product timelines or sales lacks visibility into delivery schedules, misalignment becomes inevitable. Cross-functional transparency helps teams coordinate dependencies, anticipate impacts, and make better decisions based on complete information.
Foster a culture where open communication is expected and technology makes it easy. The best collaboration tools feel invisible. They reduce friction rather than adding another system to check. When sharing updates and asking questions becomes effortless, transparency happens naturally.
Collaboration Integration Priorities:
- Embed communication tools directly within workflow platforms
- Make task ownership and status visible to all relevant stakeholders
- Enable real-time commenting and feedback on work in progress
- Provide cross-team visibility to eliminate silos and improve coordination
- Choose intuitive tools that reduce rather than increase communication friction
Pro Tip: Map communication patterns during your workflow audit. Identify where information gets stuck or decisions happen in invisible side channels. Design your collaboration integration to specifically address these gaps. Resources like remote communication tools and team productivity tools offer frameworks for analyzing communication flows and selecting appropriate solutions.
Integrating AI and Analytics Tools
Historical data tells you what happened. AI tells you what is about to happen and what you should do about it.
Deploy AI-driven content optimization and workflow analytics that learn from your operational patterns. Machine learning models can identify subtle correlations humans miss: which types of tasks consistently run over time, which team combinations produce the best results, or which external factors correlate with productivity changes. These insights enable proactive adjustments before problems materialize.
Use predictive analytics to anticipate bottlenecks and resource constraints. Instead of reacting to delays after they occur, AI models can forecast capacity issues days or weeks in advance based on current workload trends and historical completion rates. This early warning system lets you rebalance assignments, adjust deadlines, or add resources while there is still time to prevent impact.
Align team performance data with strategic business objectives. Raw productivity metrics mean nothing without context. AI analytics can connect operational efficiency to business outcomes: how workflow improvements impact customer satisfaction scores, revenue per employee, or time to market for new features. This strategic alignment, emphasized in analytics in SaaS, helps justify continued investment and guides prioritization decisions.
Keep AI models updated with fresh data. Machine learning accuracy degrades when trained on outdated patterns. As your workflows evolve, your analytics must evolve with them. Establish regular retraining cycles and monitor model performance to ensure recommendations remain relevant and reliable.
AI Analytics Implementation:
- Deploy machine learning models that identify efficiency patterns and anomalies
- Enable predictive forecasting for bottlenecks and resource constraints
- Connect operational metrics to strategic business outcomes
- Establish regular model retraining to maintain accuracy as workflows change
Security and Data Privacy Considerations
Increased visibility means increased risk if not properly protected. Workflow data often contains sensitive business information, customer details, and competitive intelligence.
Implement role-based access controls that limit data exposure by approximately 60%. Not everyone needs to see everything. Design permission structures that give teams visibility into their work and dependencies while restricting access to sensitive information outside their scope. Granular controls ensure transparency where needed without unnecessary exposure.
Maintain comprehensive audit trails for operational transparency and accountability. Every data access, modification, and export should be logged with timestamp and user identification. Audit trails serve dual purposes: they deter inappropriate access through accountability and provide forensic evidence if security incidents occur.
Comply rigorously with relevant data privacy regulations including GDPR, CCPA, and industry-specific requirements. Workflow visibility often touches personal information about employees, customers, or partners. Understand which regulations apply to your operations and ensure your systems meet technical and procedural requirements. Non-compliance carries severe financial and reputational penalties.
Regularly review and update security protocols post-deployment. Threats evolve constantly. What was secure six months ago may be vulnerable today. Schedule quarterly security assessments, apply patches promptly, and stay informed about emerging risks in your technology stack.
Balance accessibility with protection. Overly restrictive systems that frustrate legitimate users encourage workarounds that undermine security. Design controls that feel natural rather than burdensome. When security and usability align, compliance becomes sustainable.
Security Best Practices:
-
Deploy role-based access controls limiting unnecessary data exposure
-
Log all system access and modifications with comprehensive audit trails
-
Ensure compliance with GDPR, CCPA, and applicable industry regulations
-
Conduct quarterly security reviews and apply updates promptly
-
Design user-friendly security that encourages rather than defeats compliance
Common Mistakes and Troubleshooting
Most workflow visibility projects fail for predictable reasons. Knowing the pitfalls helps you avoid them.
Dashboard overload remains the most common error. Teams excited about new visibility tools try to track everything, creating cluttered interfaces that nobody uses. Research confirms that exceeding seven metrics reduces engagement by 30%. Ruthlessly prioritize. If a metric does not drive specific actions, remove it. Start minimal and add selectively based on demonstrated need.
Relying solely on generic off-the-shelf tools without customization sets you up for disappointment. Pre-built solutions work well for common workflows but struggle with the unique processes that give your company competitive advantage. The gap between what the tool offers and what you actually need creates friction, workarounds, and eventual abandonment. Invest in customization where your workflows differ meaningfully from standard patterns.
Skipping user training guarantees poor adoption. The most intuitive interface still requires onboarding. Training increases adoption rates by 45% because it builds confidence and demonstrates value. Budget time for comprehensive training sessions, create reference documentation, and designate power users who can help colleagues. Ongoing support during the first weeks proves especially critical as teams adjust to new workflows.
Unclear workflows cause visibility systems to surface confusion rather than clarity. If underlying processes are ambiguous or inconsistent, making them visible just highlights the chaos. Fix broken workflows before automating them. Document standard procedures, eliminate unnecessary steps, and ensure team alignment on how work should flow.
Common Implementation Pitfalls:
- Overloading dashboards beyond 7 key metrics
- Deploying generic tools without necessary customization
- Inadequate user training and ongoing support
- Implementing visibility before clarifying underlying workflows
- Ignoring user feedback during rollout and refinement
| Customization Level | Implementation Speed | Cost | Flexibility | Best For |
|---|---|---|---|---|
| Off-the-Shelf | 2 to 4 weeks | Low | Limited | Standard workflows, small teams |
| Configured Platform | 6 to 10 weeks | Medium | Moderate | Common processes with minor variations |
| Custom Build | 12 to 16 weeks | Higher | Extensive | Unique workflows, competitive differentiation |
| Hybrid Approach | 8 to 12 weeks | Medium-High | High | Mix of standard and unique processes |
Pro Tip: Create a feedback loop during initial rollout. Meet weekly with users to identify pain points, confusion, and feature requests. Many issues that seem like bugs are actually training gaps or workflow misunderstandings. Address these quickly while enthusiasm is high. Early responsiveness builds trust and signals that user input shapes the final system. The contrast between dashboard design pitfalls and successful implementations consistently traces back to active user engagement during rollout.
Alternative Approaches and Tradeoffs
No single approach fits every company. Understanding the tradeoffs helps you choose wisely.
Custom digital solutions deliver approximately 20% improvement in task delays compared to generic tools. This advantage comes from precise alignment with your specific workflows rather than forcing your processes into someone else’s structure. Custom builds adapt to your needs rather than requiring you to adapt to the software. For growth-stage SaaS companies with unique operational processes, this flexibility often justifies the additional investment.
Enterprise software promises comprehensive functionality but carries significant overhead. Implementation timelines stretch from 6 to 12 months as you configure complex systems and migrate data. Costs run up to 40% higher than custom solutions when accounting for licensing, consulting fees, and ongoing maintenance. Enterprise platforms make sense when you need battle-tested solutions for common processes and have the resources to support lengthy implementations.
Off-the-shelf tools offer speed and low initial cost. You can deploy basic workflow visibility in weeks rather than months. However, these solutions lack scalability and customization capabilities. As your company grows and your processes become more sophisticated, you will outgrow the tool and face migration costs. Off-the-shelf works well for early-stage companies or teams with highly standardized workflows.
Custom builds provide better total cost of ownership for growing companies. Initial investment runs higher but ongoing costs stay lower because you are not paying per-user licenses that scale with headcount. Maintenance focuses on your actual needs rather than supporting features you never use. The adaptability means the system grows with you instead of requiring replacement every few years, as explored in enterprise vs custom software.
| Approach | Implementation Time | Relative Cost | Scalability | Customization | Ideal Company Stage |
|---|---|---|---|---|---|
| Off-the-Shelf | 2 to 4 weeks | Low | Limited | Minimal | Early stage, standard workflows |
| Enterprise Software | 6 to 12 months | Very High | Excellent | Moderate | Large organizations, common processes |
| Custom Build | 12 to 16 weeks | High | Excellent | Extensive | Growth stage, unique workflows |
| Configured Platform | 6 to 10 weeks | Medium | Good | Moderate | Mid-size teams, some customization |
Expected Outcomes and Timelines
Realistic expectations prevent disappointment and help you measure success accurately.
Operational efficiency improvements typically become observable within 3 to 6 months after implementation. This timeline reflects the learning curve as teams adapt to new tools and workflows stabilize. Early wins often appear sooner in specific areas, but company-wide efficiency gains require time for adoption to reach critical mass and for process improvements to compound.
Properly executed workflow visibility enhancements deliver up to 40% gains in overall operational efficiency. This significant improvement comes from multiple factors working together: reduced time searching for information, fewer duplicated efforts, earlier problem detection, and better resource allocation. The gains accumulate as visibility enables continuous optimization.
User adoption rates increase by 45% when implementations include comprehensive training and ongoing support. Technology alone does not change behavior. People need to understand not just how to use new tools but why the change matters and how it makes their work easier. Sustained support during the transition period proves crucial for embedding new practices.
Continuous monitoring and iteration remain necessary for lasting success. Initial implementation is the beginning, not the end. As you use workflow visibility tools, you will discover new optimization opportunities, identify metrics that matter more than expected, and find areas where visibility remains insufficient. Plan for quarterly reviews and ongoing refinement.
Timeline and Outcome Expectations:
- Months 1 to 2: Initial deployment, user training, and workflow adjustment period with limited measurable gains
- Months 3 to 4: Early efficiency improvements become visible as adoption reaches 60% to 70% of users
- Months 5 to 6: Compound effects emerge as teams optimize based on new visibility, approaching target efficiency gains
- Months 7 plus: Ongoing refinement and optimization based on usage patterns and evolving business needs
Set measurable benchmarks upfront for ongoing evaluation. Define specific targets for task completion time, bottleneck frequency, resource utilization, and other KPIs identified during planning. Regular measurement against these benchmarks shows whether you are on track and where additional adjustments might help. The frameworks in workflow efficiency metrics provide structured approaches to defining and tracking relevant indicators.
Explore Custom Workflow Solutions at Rule27 Design
Enhancing workflow visibility requires more than selecting tools. It demands understanding how your team actually works and building systems that fit naturally into those patterns.
Rule27 Design specializes in creating customized administrative systems and digital infrastructure that match your operational reality. We build solutions that provide genuine visibility without overwhelming your team, integrate seamlessly with your existing tools, and scale as your company grows. Our approach combines clean interface design with robust technical architecture, delivering systems people actually want to use rather than tools that gather dust.
Our clients typically see the 40% efficiency improvements discussed throughout this article. We achieve these results through careful workflow analysis, targeted KPI identification, and iterative design that prioritizes user adoption. Whether you need custom dashboards, integrated collaboration platforms, or AI-enhanced analytics, we build solutions aligned with your specific operational challenges. Learn more about custom digital solutions, compare custom vs enterprise software options, or explore detailed workflow efficiency insights to see how we help growth-stage SaaS companies achieve measurable operational improvements.
Frequently Asked Questions
What are the key KPIs to track for workflow visibility?
Focus on metrics that reveal bottlenecks and efficiency patterns: task completion time, delay frequency, bottleneck occurrence locations, and user adoption rates. These indicators provide actionable visibility rather than vanity numbers. Your specific KPIs should align closely with your team’s unique processes and strategic goals, typically numbering 4 to 6 core metrics.
How long does it take to see improvements after implementing new workflow tools?
Most companies observe measurable efficiency gains within 3 to 6 months after deployment. Early improvements often appear sooner in specific areas, but company-wide efficiency gains require time for adoption to reach critical mass. Timelines depend heavily on training quality, user adoption rates, and your commitment to continuous process refinement based on new visibility.
What is the biggest mistake to avoid when enhancing workflow visibility?
Overloading dashboards with too many metrics reduces user engagement and clarity by approximately 30%, according to dashboard design research. Limit dashboards to 5 to 7 key indicators that directly drive decisions and actions. More metrics create confusion rather than insight, causing teams to ignore the dashboard entirely.
Are off-the-shelf workflow tools sufficient for growth-stage SaaS companies?
Approximately 70% of growth-stage SaaS companies find off-the-shelf tools inadequate for their specific operational workflows as they scale. Generic solutions work well initially but lack the flexibility and customization needed as your processes become more sophisticated and unique. Custom or highly configurable solutions provide better long-term value for companies with differentiated workflows that drive competitive advantage.

About the Author
Josh AndersonCo-Founder & CEO at Rule27 Design
Operations leader and full-stack developer with 15 years of experience disrupting traditional business models. I don't just strategize, I build. From architecting operational transformations to coding the platforms that enable them, I deliver end-to-end solutions that drive real impact. My rare combination of technical expertise and strategic vision allows me to identify inefficiencies, design streamlined processes, and personally develop the technology that brings innovation to life.
View Profile

